
Each week, I participate in a social project called #TidyTuesday hosted by R4DS community. They provide a raw dataset with the goal of creating meaningful data visualizations. The project allows pariticipants to practice their data wrangling and data visualization skills and connect with the greater #rstats community. Below are some featured visualizations that I generated as part of this project. If you are interested in checking out all the other visualizations, they are on my github.
College Tuition
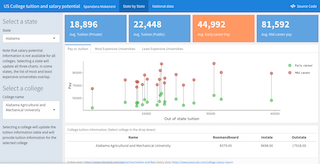
For this visualization project, I analyzed college tuition and pay data for 2018 across the US. I used R shiny flexdashboard to create an interactive dashboard that allows the users to explore the correlation between college tuition and early career incomes by state.
Broadway Incomes

For this project, I analyzed broadway incomes data and aggregated weekly gross incomes per year by show to visualize top 10 shows every year from 2010-2019. I created an animated plot using the gganimate package in R.
Brain Injury Statistics
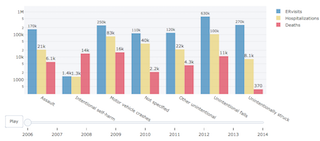
I analyzed brain injury data from 2006-2014 and created an interactive plot using plotly that summarizes the statistics for traumatic brain injuries in the United States.
CHOPPED: word cloud analysis
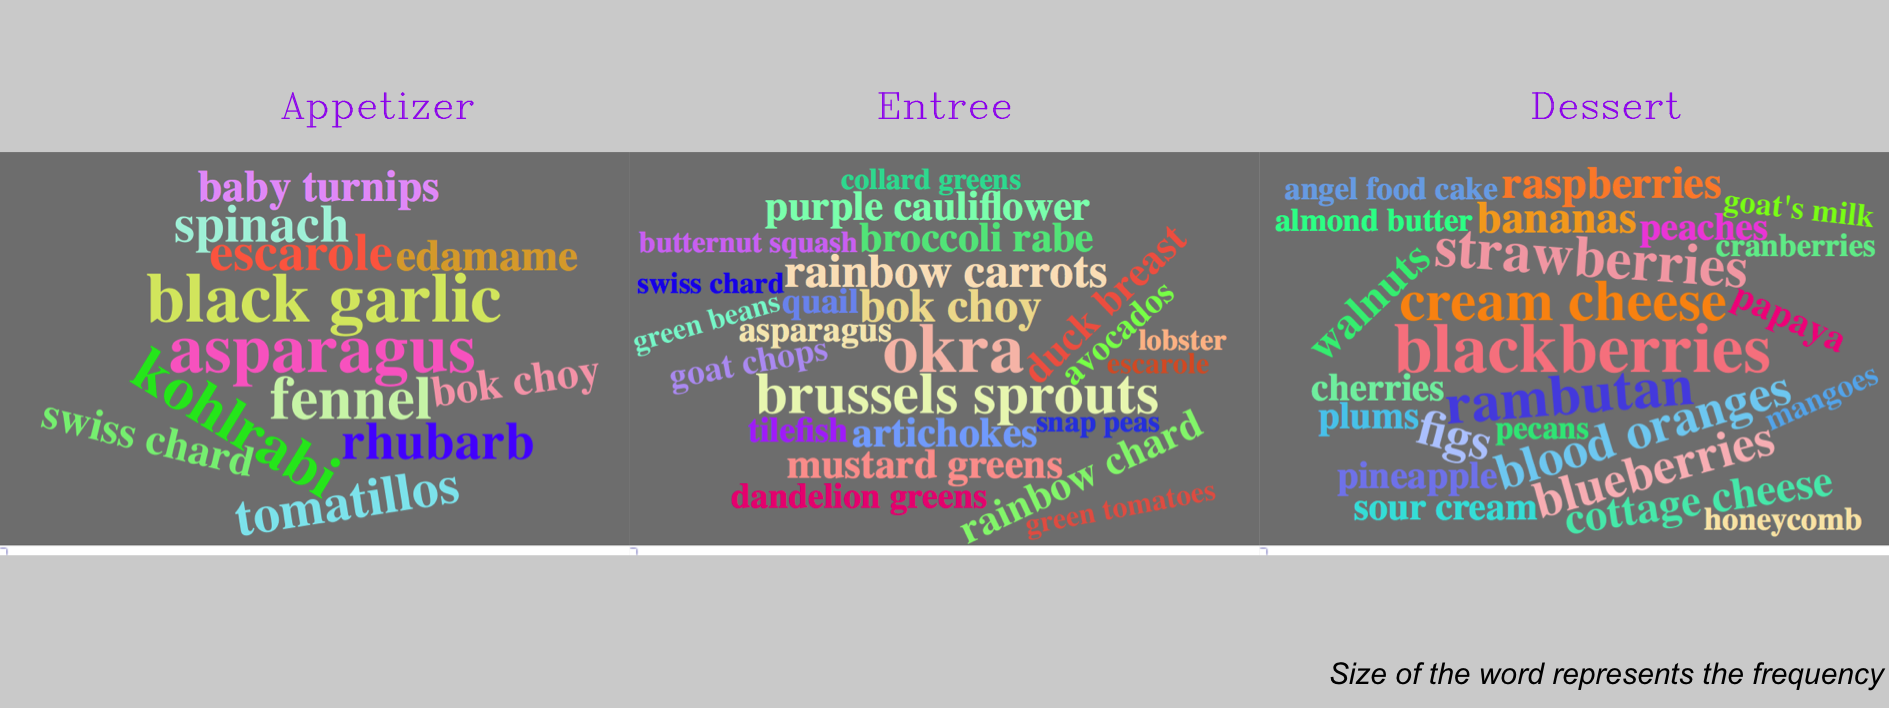
Chopped is an american reality-based cooking show. I analyzed 10+ years of episode data and used word cloud plots to look at the most common ingredients used for each course.
Tracking Caribou
I analyzed data that tracks woodland caribou in northern British Columbia and created an animated plot using gganimate that shows the movements of caribou between 2001-2016